Fig. 12
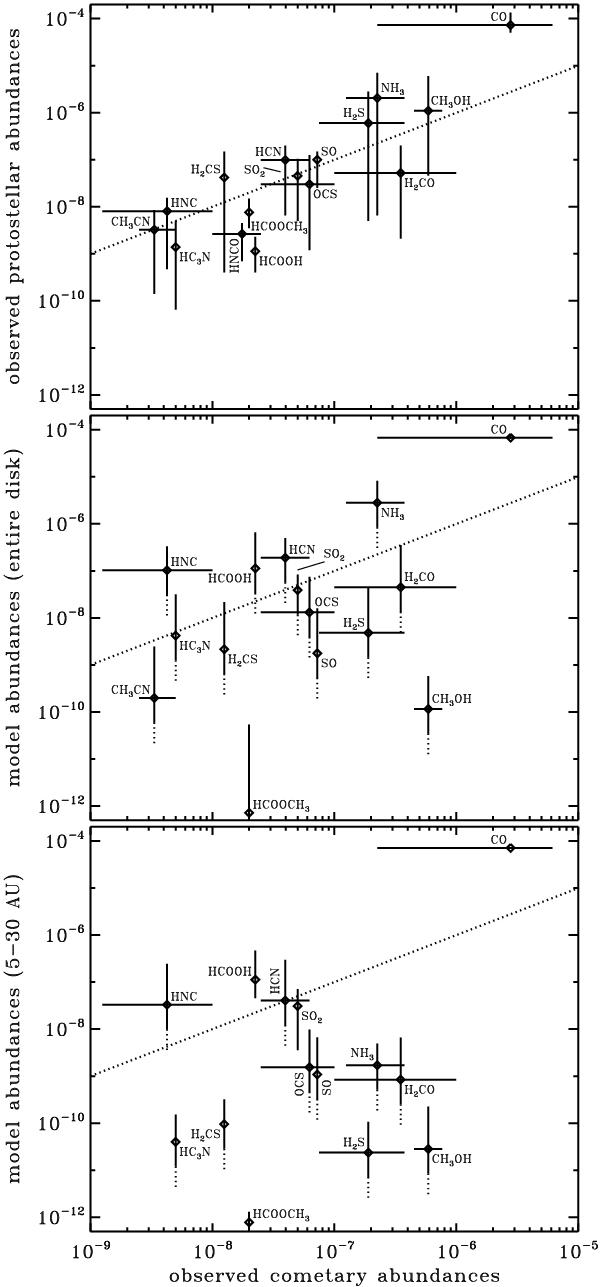
Top: abundances observed in comets versus gas-phase abundances observed in young protostars. Middle and bottom: abundances observed in comets versus total abundances (gas and ice) from our model at t = tacc. All abundances are relative to nH. For the observational data points, the error bars indicate the spread between sources. For the model data, they indicate the range of values across the entire disk (middle) or the comet-forming region (bottom). Dotted error bars indicate the full range extends to less than 10-12. The diagonal dotted lines represent hypothetical one-to-one relationships between abundances on the x and y axes.
Current usage metrics show cumulative count of Article Views (full-text article views including HTML views, PDF and ePub downloads, according to the available data) and Abstracts Views on Vision4Press platform.
Data correspond to usage on the plateform after 2015. The current usage metrics is available 48-96 hours after online publication and is updated daily on week days.
Initial download of the metrics may take a while.