Fig. 8
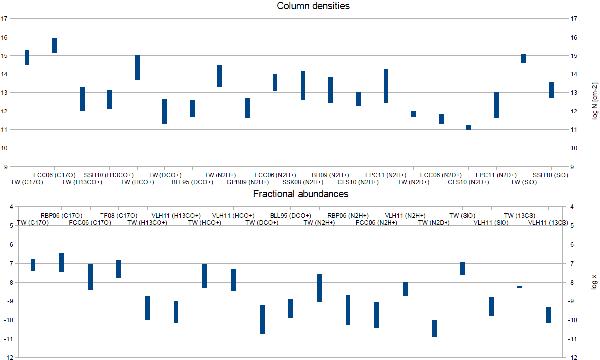
Range of molecular column densities (upper panel) and fractional abundances (lower panel) for our sources as compared with similar samples of other studies. The y-axes are shown on a logarithmic scale. The abbreviation TW refers to this work. The references are coded as follows: FCC06 = Fontani et al. (2006), SSH10 = Sakai et al. (2010), BLL95 = Butner et al. (1995), GPB09 = Gibson et al. 2009, SSK08 = Sakai et al. (2008), BH09 = Beuther & Henning (2009), CLS10 = Chen et al. (2010), FPC11 = Fontani et al. (2011), RBP06 = Ragan et al. (2006), TF08 = Thomas & Fuller (2008), VLH11 = Vasyunina et al. (2011). The 13CS abundance of ~ 6.2 × 10⁻⁹ we derived towards I18102 MM1 is shown by a slightly stretched bar for clarity.
Current usage metrics show cumulative count of Article Views (full-text article views including HTML views, PDF and ePub downloads, according to the available data) and Abstracts Views on Vision4Press platform.
Data correspond to usage on the plateform after 2015. The current usage metrics is available 48-96 hours after online publication and is updated daily on week days.
Initial download of the metrics may take a while.