Fig. 5
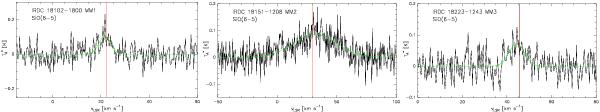
SiO(6 − 5) spectra overlaid with Gaussian fits. The vertical line in each panel indicates the vLSR of the clump as measured from N2H+(1 − 0) by SSK08, i.e., 22.36, 29.74, and 45.73 km s-1 for I18102 MM1, I18151 MM2, and I18223 MM3, respectively. The velocity range in each panel is wider compared to that of Fig. 2 for clarity.
Current usage metrics show cumulative count of Article Views (full-text article views including HTML views, PDF and ePub downloads, according to the available data) and Abstracts Views on Vision4Press platform.
Data correspond to usage on the plateform after 2015. The current usage metrics is available 48-96 hours after online publication and is updated daily on week days.
Initial download of the metrics may take a while.