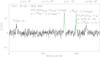
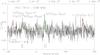
Fig. 3
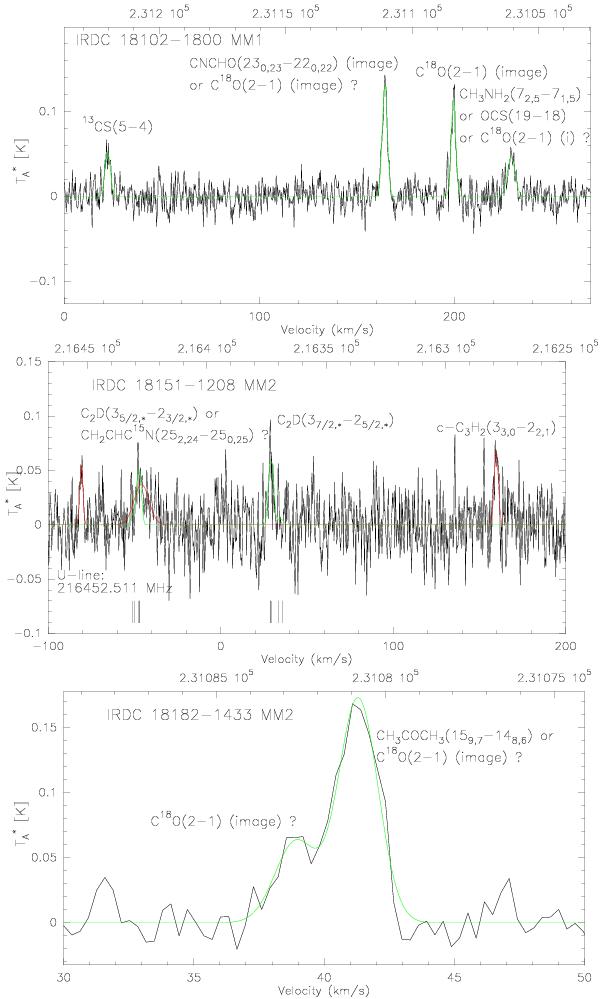
Multi-line spectra of I18102 MM1, I18151 MM2, and I18182 MM2. On the spectrum towards I18151 MM2, the green line shows the hf-structure fit to C2D(3−2), and the red line indicates single Gaussian fits to the other lines. The relative velocities of the C2D(3−2) hf components are labelled with a short bar. On the other spectra, the green line represents single Gaussian fits.
Current usage metrics show cumulative count of Article Views (full-text article views including HTML views, PDF and ePub downloads, according to the available data) and Abstracts Views on Vision4Press platform.
Data correspond to usage on the plateform after 2015. The current usage metrics is available 48-96 hours after online publication and is updated daily on week days.
Initial download of the metrics may take a while.