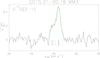
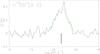
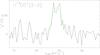
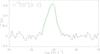
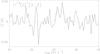
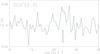
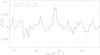
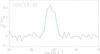
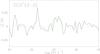
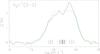
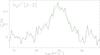
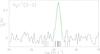
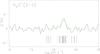
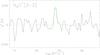
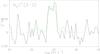
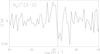
Fig. 2
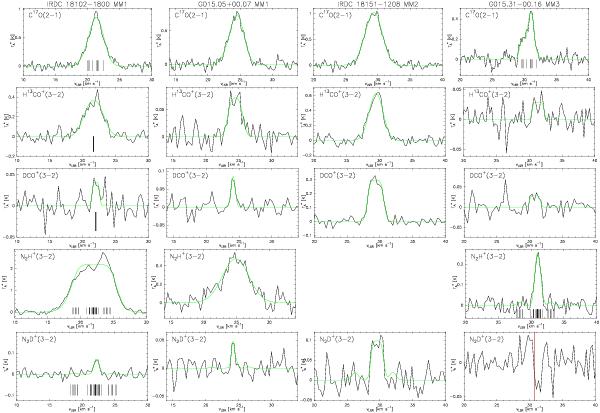
Smoothed C17O(2−1), H13CO+(3−2), DCO+(3−2), N2H+(3−2), and N2D+(3−2) spectra (top to bottom) towards the clumps (left to right). Overlaid on the spectra are the hf-structure fits. The relative velocities of each individual hf components in each observed transition are labelled with a short bar on the spectra towards I18102 MM1; these are also shown in the C17O and N2H+ spectra towards G015.31 MM3. The red vertical line on the N2D+ spectrum towards G015.31 MM3 shows the vLSR = 30.81 km s-1 of the clump as measured from N2H+(1 − 0) by SSK08. Note that N2H+(3−2) observations were carried out only towards three sources and that N2D+(3−2) was not detected towards G015.31 MM3, I18182 MM2, and J18364 SMM1.

Current usage metrics show cumulative count of Article Views (full-text article views including HTML views, PDF and ePub downloads, according to the available data) and Abstracts Views on Vision4Press platform.
Data correspond to usage on the plateform after 2015. The current usage metrics is available 48-96 hours after online publication and is updated daily on week days.
Initial download of the metrics may take a while.