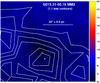
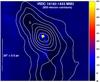
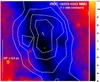
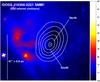
Fig. 1
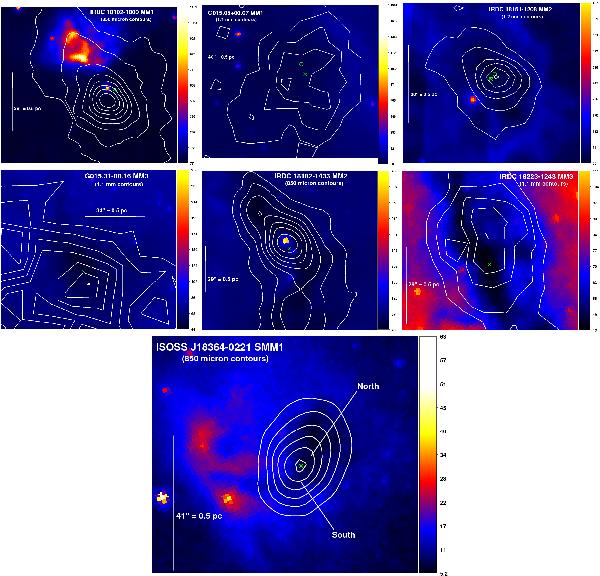
Spitzer/IRAC 8-μm images overlaid with contours of (sub)mm dust continuum emission (SCUBA 850 μm, Bolocam 1.1 mm, MAMBO 1.2 mm). The colour bars indicate the 8-μm intensity scales in units of MJy sr-1. The contour step-size is 0.1 Jy beam-1 in all cases except G015.31 MM3 where it is 0.02 Jy beam-1. The contours go as follows: from 0.02 to 0.14 Jy beam-1 for G015.31 MM3; from 0.1 to 0.7 Jy beam-1 for G015.05 MM1 and I18151 MM2; from 0.2 to 0.7 Jy beam-1 for J18364 SMM1; from 0.2 to 0.9 Jy beam-1 for I18182 MM2; from 0.2 to 2.3 Jy beam-1 for I18102 MM1; and from 0.3 to 0.7 Jy beam-1 for I18223 MM3. The crosses indicate the positions of our molecular-line observations. The box symbol towards I18102 MM1 indicates the position of the 6.7 GHz Class II CH3OH maser (Beuther et al. 2002b). For I18151 MM2, the box symbol shows the position of the 84.5 GHz Class I CH3OH maser (Marseille et al. 2010b); it coincides with our target position. The circles indicate the positions of the 22.2 GHz H2O masers associated with I18151 MM2 (Beuther et al. 2002b) and G015.05 MM1 (Wang et al. 2006). The mm peak positions of the northern and southern cores within the clump J18364 SMM1 are indicated (Hennemann et al. 2009). The scale bar in each panel corresponds to 0.5 pc.
Current usage metrics show cumulative count of Article Views (full-text article views including HTML views, PDF and ePub downloads, according to the available data) and Abstracts Views on Vision4Press platform.
Data correspond to usage on the plateform after 2015. The current usage metrics is available 48-96 hours after online publication and is updated daily on week days.
Initial download of the metrics may take a while.