Fig. 3
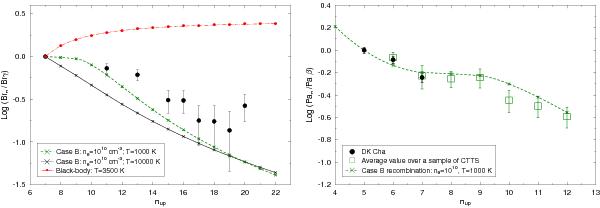
Left panel: comparison between the observed DK Cha Brackett decrement and the expected curves for Case B recombination and black-body emission. The crosses represent the ratios from case B recombination at T = 10 000 K, n = 1010 cm-3 (black continuous line) and T = 1000 K, n = 1010 cm-3 (green dashed line), while dots represent the black-body curves at T = 3500 K (dashed red line). Right panel: comparison between the observed DK Cha Paschen decrement (black dots), the Paschen decrement of the CTTSs sample of Bary et al. (2008, open green squares) and the expected Paschen ratios from Case B recombination at T = 1000 K, n = 1010 cm-3 (green dashed line).
Current usage metrics show cumulative count of Article Views (full-text article views including HTML views, PDF and ePub downloads, according to the available data) and Abstracts Views on Vision4Press platform.
Data correspond to usage on the plateform after 2015. The current usage metrics is available 48-96 hours after online publication and is updated daily on week days.
Initial download of the metrics may take a while.