Fig. 2
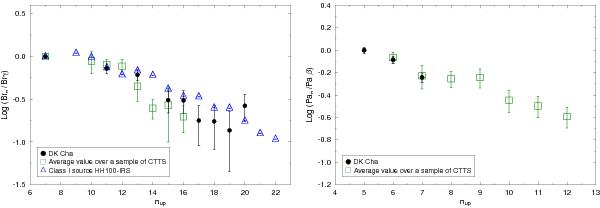
Left panel: ratio of the DK Cha Brackett lines with respect to Br γ plotted as a function of the upper quantum number (nup; filled black circles). For comparison the Brackett decrements for the Class I source HH100-IRS (Nisini et al. 2004, open blue triangles) and the weighted mean line ratios for the Brackett series on the CTTSs sample of Bary et al. (2008, open green squares) are also included in the plot. Right panel: ratio of the DK Cha Paschen lines with respect to the Pa β line as a function of the upper quantum number nup (black filled circles). For comparison, the weighted mean line ratios for the Paschen series on the CTTSs sample of Bary et al. (2008, open green squares) are also shown.
Current usage metrics show cumulative count of Article Views (full-text article views including HTML views, PDF and ePub downloads, according to the available data) and Abstracts Views on Vision4Press platform.
Data correspond to usage on the plateform after 2015. The current usage metrics is available 48-96 hours after online publication and is updated daily on week days.
Initial download of the metrics may take a while.