Fig. 8
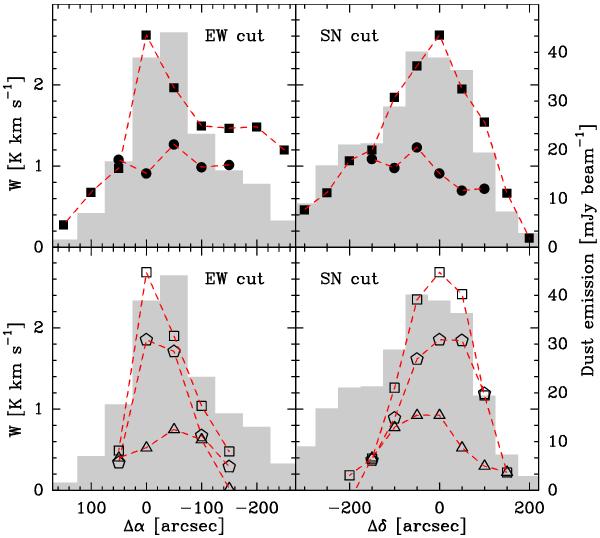
Comparison between the dust emission (gray histograms) and the integrated intensity of the observed species along the two cuts in TMC 2. Upper panels: solid squares, HCN(1−0) [× 4]; solid circles, C18O(2−1). Lower panels: empty triangles, H13CN(1−0) [× 25]; empty squares, HN13C(1−0) [× 3.5]; empty pentagons, N2H+(1−0) [× 4.5]. The typical error on the integrated intensity is about 20 mK km s-1.
Current usage metrics show cumulative count of Article Views (full-text article views including HTML views, PDF and ePub downloads, according to the available data) and Abstracts Views on Vision4Press platform.
Data correspond to usage on the plateform after 2015. The current usage metrics is available 48-96 hours after online publication and is updated daily on week days.
Initial download of the metrics may take a while.