Fig. 2
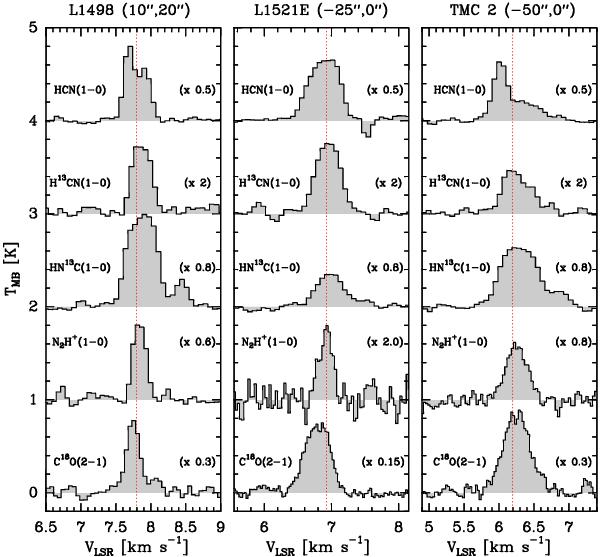
Emission line for the different tracers of the source sample towards the dust emission peak. The 88 633 MHz component of HCN(1−0) is shown together with the 86 340 MHz component of H13CN(1−0), HN13C(1−0), the 93 176 MHz isolated component of N2H + (1−0), and C18O(2−1). Spectra have been multiplied by a scaling factor to allow the simultaneous comparison. Red dotted lines show the systemic LSR velocity of the sources evaluated from the well-determined frequencies of N2H + (1−0), see Pagani et al. (2009).
Current usage metrics show cumulative count of Article Views (full-text article views including HTML views, PDF and ePub downloads, according to the available data) and Abstracts Views on Vision4Press platform.
Data correspond to usage on the plateform after 2015. The current usage metrics is available 48-96 hours after online publication and is updated daily on week days.
Initial download of the metrics may take a while.