Free Access
Fig. 16
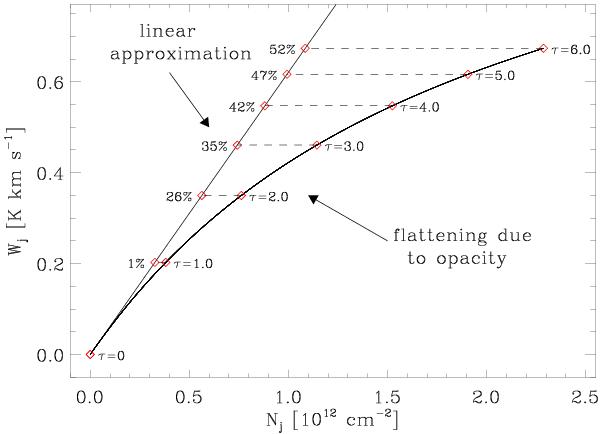
H13CN(1−0) integrated intensity as a function of the column density of the J = 1 level for Tex = 3.56 K (the highest excitation temperature observed in L1498). The percentage values show the deviation of the linear approximation with respect to the correct value taking account for optical depth.
Current usage metrics show cumulative count of Article Views (full-text article views including HTML views, PDF and ePub downloads, according to the available data) and Abstracts Views on Vision4Press platform.
Data correspond to usage on the plateform after 2015. The current usage metrics is available 48-96 hours after online publication and is updated daily on week days.
Initial download of the metrics may take a while.