Fig. 15
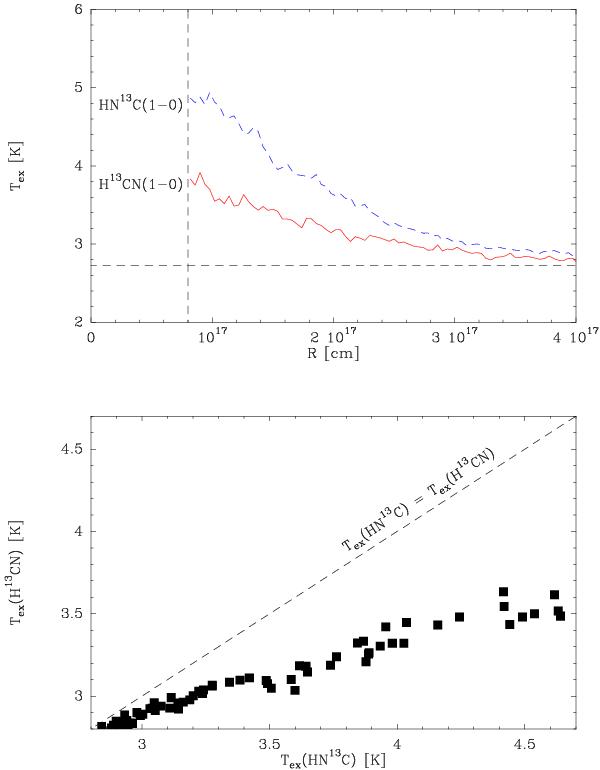
Upper panel: radial profile of excitation temperature for H13CN(1−0), red solid line, and HN13C(1−0), blue dashed line, in L1498 as predicted by our best fit Monte Carlo model; the vertical dashed line represents the central hole radius and the horizontal dashed line shows the cosmic background temperature limit. Lower panel: comparison between HN13C(1−0) and H13CN(1−0) local values of the excitation temperature in each core shell; the dashed line depicts the positions where the two excitation temperatures would be equal.
Current usage metrics show cumulative count of Article Views (full-text article views including HTML views, PDF and ePub downloads, according to the available data) and Abstracts Views on Vision4Press platform.
Data correspond to usage on the plateform after 2015. The current usage metrics is available 48-96 hours after online publication and is updated daily on week days.
Initial download of the metrics may take a while.