Fig. 14
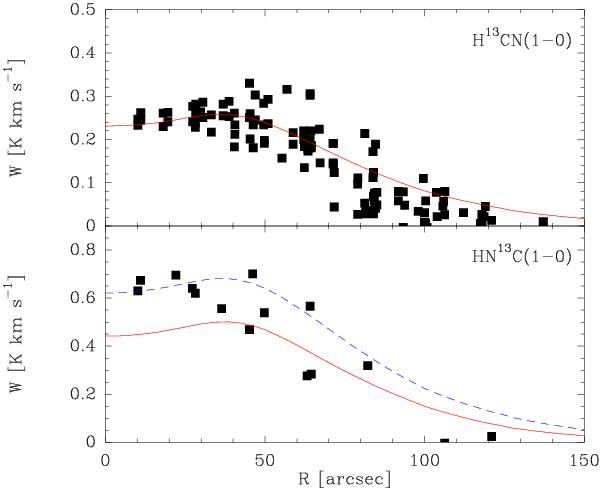
Radial profile of observed H13CN(1−0) and HN13C(1−0) integrated intensities (upper and lower panel, respectively) and model prediction for a core with a central hole of 8 × 1016 cm and an outer abundance value of 1.7 × 10⁻¹⁰ (red solid lines) and 2.04 × 10⁻¹⁰ (blue dashed line). HN13C(1−0) data come from this study and H13CN(1−0) data come from this study and Tafalla et al. (2006).
Current usage metrics show cumulative count of Article Views (full-text article views including HTML views, PDF and ePub downloads, according to the available data) and Abstracts Views on Vision4Press platform.
Data correspond to usage on the plateform after 2015. The current usage metrics is available 48-96 hours after online publication and is updated daily on week days.
Initial download of the metrics may take a while.