Fig. 11
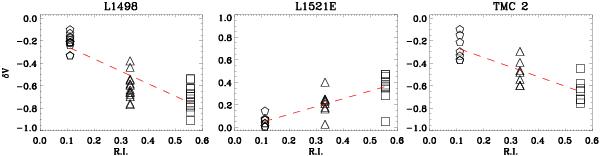
Degree of skewness as a function of the relative intensities of the hyperfine components of HCN(1−0). Linear regressions emphasise the relationship between δV and line strength (dashed red lines). Values of δV from observations of the F = 1 → 1 component (triangles), the F = 2 → 1 component (squares), and the F = 0 → 1 component (pentagons).
Current usage metrics show cumulative count of Article Views (full-text article views including HTML views, PDF and ePub downloads, according to the available data) and Abstracts Views on Vision4Press platform.
Data correspond to usage on the plateform after 2015. The current usage metrics is available 48-96 hours after online publication and is updated daily on week days.
Initial download of the metrics may take a while.