Fig. 8
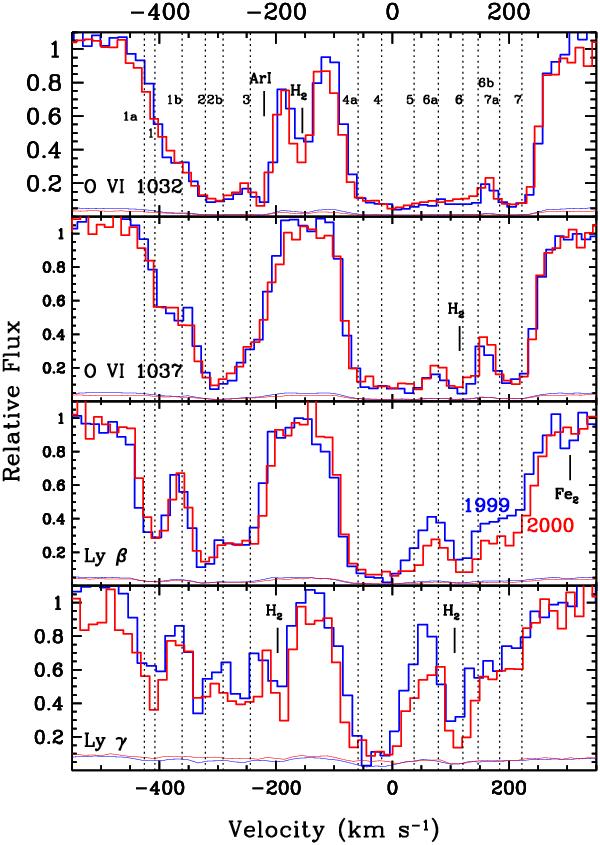
Comparison of spectral features in the FUSE spectra of Mrk 509 from 1999 November (blue) and 2000 September (red). Normalized relative fluxes are plotted as a function of velocity relative to the systemic redshift of z = 0.034397. The individual panels (from top to bottom) show O viλ1032, O viλ1037, Lyβ, and Lyγ. Foreground Galactic ISM features are marked. Error vectors for each spectrum are shown as thin lines in the same color as the data.
Current usage metrics show cumulative count of Article Views (full-text article views including HTML views, PDF and ePub downloads, according to the available data) and Abstracts Views on Vision4Press platform.
Data correspond to usage on the plateform after 2015. The current usage metrics is available 48-96 hours after online publication and is updated daily on week days.
Initial download of the metrics may take a while.