Free Access
Fig. 7
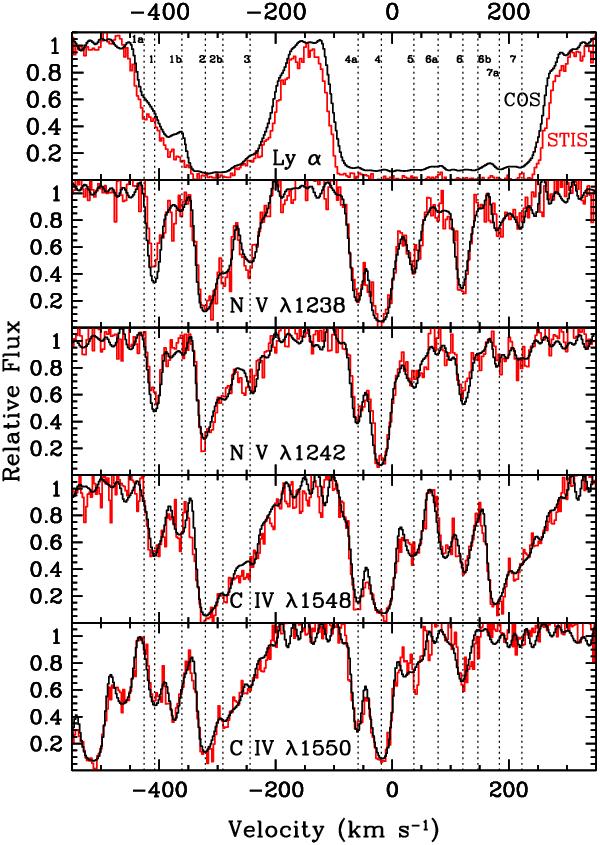
Comparison of spectral features in the COS (black) and STIS (red) spectra of Mrk 509. Normalized relative fluxes are plotted as a function of velocity relative to the systemic redshift of z = 0.034397. The individual panels (from top to bottom) show Lyα, N vλ1238, N vλ1242, C ivλ1548, and C ivλ1550.
Current usage metrics show cumulative count of Article Views (full-text article views including HTML views, PDF and ePub downloads, according to the available data) and Abstracts Views on Vision4Press platform.
Data correspond to usage on the plateform after 2015. The current usage metrics is available 48-96 hours after online publication and is updated daily on week days.
Initial download of the metrics may take a while.