Fig. 6
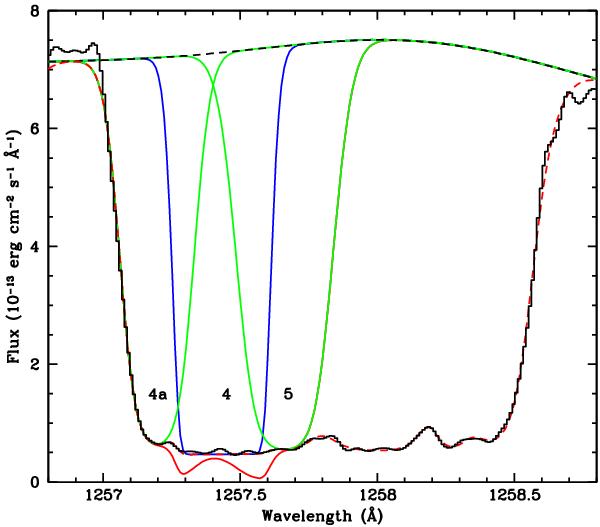
Fit to a portion of the Lyα absorption trough in the COS spectrum of Mrk 509. The data are shown by the solid black histogram. The red dashed line shows the best fit model using the scattered-light/single partial covering fraction described above for fc = 0.064. The black dashed line shows the emission model for this region. The absorption in this model due to components 4a (shown in green), 4 (shown in blue) and 5 (shown in green) are plotted individually. The solid red line shows the resulting model if these absorbing components each have independent partial covering factors fc,4a = fc,4 = fc,5 = 0.064. The dips in the region of overlap between each component are prominent at wavelengths of ~1257.3 Å and 1257.6 Å.
Current usage metrics show cumulative count of Article Views (full-text article views including HTML views, PDF and ePub downloads, according to the available data) and Abstracts Views on Vision4Press platform.
Data correspond to usage on the plateform after 2015. The current usage metrics is available 48-96 hours after online publication and is updated daily on week days.
Initial download of the metrics may take a while.