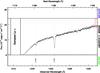
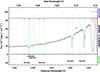
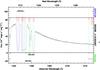
Fig. A.1
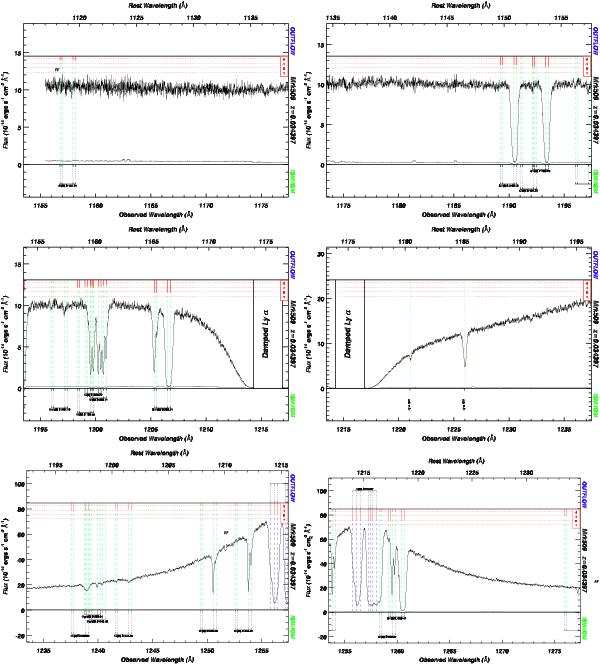
Full resolution, calibrated and merged COS spectrum of Mrk 509. Each absorption feature is marked. Absorption troughs identified as being part of the intrinsic outflow observed in Mrk 509 are marked by dashed blue lines. Kinematic components deduced from the N v and C iv doublets are displayed in the upper part of each figure along with the name of the respective spectral line. Absorption features identified as associated with the interstellar medium (ISM) in our own Galaxy or in the intergalactic medium (IGM) are marked by dashed green lines. For the ISM lines, the pattern of the strongest four kinematic components deduced from the ISM C iv doublet is displayed in the lower part of the figure. The naming convention adopted for the spectral lines is the following: ion(Elow)λ0, where “ion” is the name of the ion, “Elow”, the lower energy level of the considered transition, and “λ0” is the rest wavelength of the transition. The length of the red line indicates the strength of the plotted line (log (fosc), where fosc is the oscillator strength) with a scale indicated by the horizontal red dashed lines. IGM Lyα absorption lines are labeled in the “ISM/IGM” section using the label “Lyα IGM”. Known flat-field problems are flagged with the label “FF" or “FF?”.
Current usage metrics show cumulative count of Article Views (full-text article views including HTML views, PDF and ePub downloads, according to the available data) and Abstracts Views on Vision4Press platform.
Data correspond to usage on the plateform after 2015. The current usage metrics is available 48-96 hours after online publication and is updated daily on week days.
Initial download of the metrics may take a while.