Fig. 7
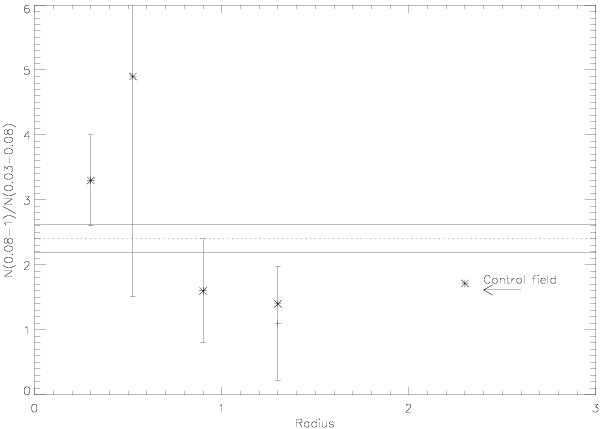
The ratio of low-mass stars (0.08–1.0 M⊙) to brown dwarfs (0.03–0.08 M⊙) for the ONC as a function of radius. The plus signs with error bars indicate the field star corrected measurements whereas the squares indicate the measurements before field star subtraction. The inner data point is from Slesnick et al. (2004) and the horizontal line is the average ratio with the 1σ error interval provided by the dashed lines.
Current usage metrics show cumulative count of Article Views (full-text article views including HTML views, PDF and ePub downloads, according to the available data) and Abstracts Views on Vision4Press platform.
Data correspond to usage on the plateform after 2015. The current usage metrics is available 48-96 hours after online publication and is updated daily on week days.
Initial download of the metrics may take a while.