Fig. 5
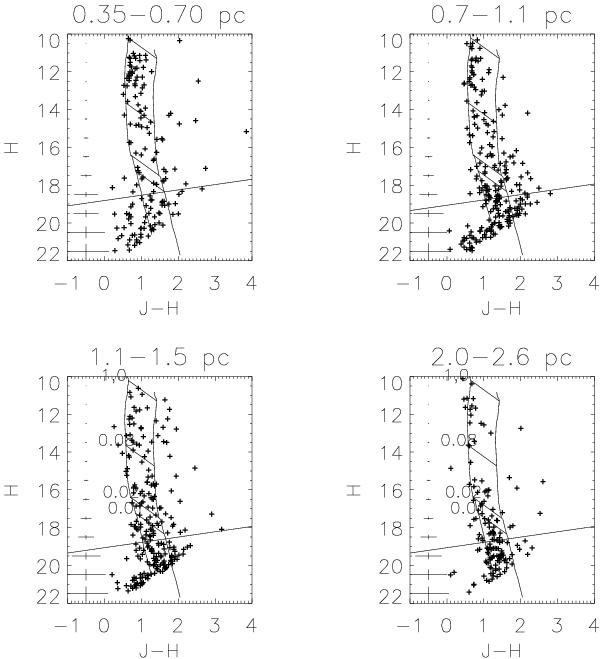
The color–magnitude diagram for the surveyed region. Overplotted are a 1 Myr isochrone (Baraffe et al. 1998) shifted to the distance of the ONC, the same isochrone reddened by AV = 7 mag, and the 50% completeness limit for the data. Masses for a 1 Myr population of 1.0, 0.08, 0.02, and 0.01 M⊙ are indicated on the lower left panel. The region used as control field is shown in the lower right corner (2.3–2.6 pc). The typical photometric and colour error are shown in each diagram as a function of object magnitude.
Current usage metrics show cumulative count of Article Views (full-text article views including HTML views, PDF and ePub downloads, according to the available data) and Abstracts Views on Vision4Press platform.
Data correspond to usage on the plateform after 2015. The current usage metrics is available 48-96 hours after online publication and is updated daily on week days.
Initial download of the metrics may take a while.