Free Access
Fig. 3
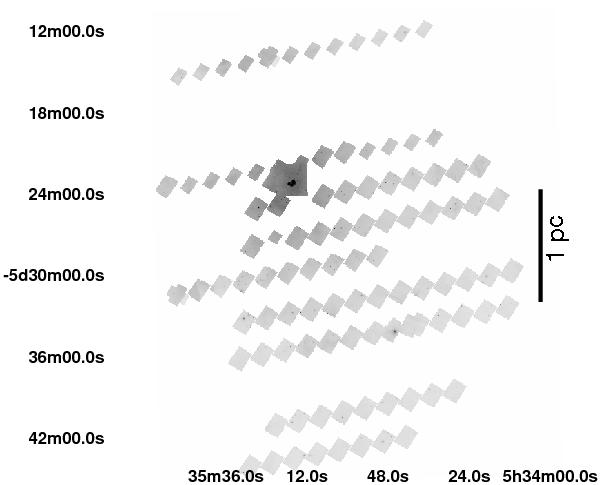
F160W band 26′ × 33′ mosaic of the observed region within the ONC. For reference, the central 140″ × 140″ region observed by Luhman et al. (2000) is included. The location of the Trapezium stars are marked by small boxes in the mosaic. North is up and East is to the left.
Current usage metrics show cumulative count of Article Views (full-text article views including HTML views, PDF and ePub downloads, according to the available data) and Abstracts Views on Vision4Press platform.
Data correspond to usage on the plateform after 2015. The current usage metrics is available 48-96 hours after online publication and is updated daily on week days.
Initial download of the metrics may take a while.