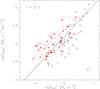
Fig. 17

Panel a) The relation between the surface density of the molecular gas and the SFR per area for morphological types T = 3–5, calculated by dividing the molecular gas mass and the SFR derived from LFIR by the surface of the galaxies, π(D25/2)2. The full line shows the bisector best fit for this sample, and the dashed line the best fit to the sample of all morphological types. Panel b) The same relation with the total (atomic + molecular) gas surface density. The blue triangles show the galaxies with either an upper limit in HI or in CO. The gas surface density for these galaxies has a lower and an upper limit which for the galaxies in this figure are very close together (within the size of the triangle).
Current usage metrics show cumulative count of Article Views (full-text article views including HTML views, PDF and ePub downloads, according to the available data) and Abstracts Views on Vision4Press platform.
Data correspond to usage on the plateform after 2015. The current usage metrics is available 48-96 hours after online publication and is updated daily on week days.
Initial download of the metrics may take a while.