Fig. 6
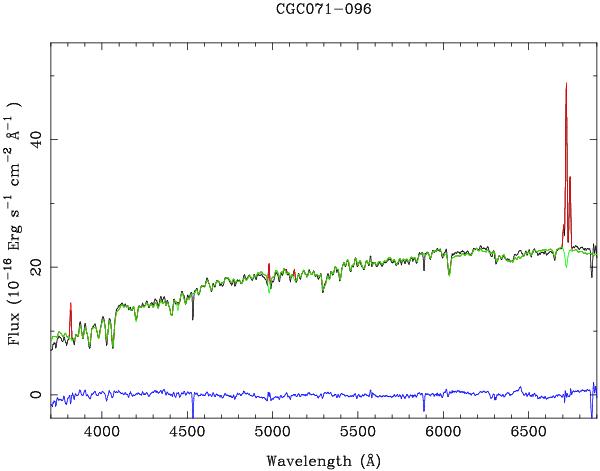
Example of the decoupling of emission lines and underlying stellar population for CGC071-096. We show the central spectrum as a black line, the best-fit model of the emission lines in red, and the best-fit stellar population, modelled as a linear combination of different SSPs, plus the computed dust extinction, in green. Finally, the differences between the real spectrum and the final fitting is shown in blue.
Current usage metrics show cumulative count of Article Views (full-text article views including HTML views, PDF and ePub downloads, according to the available data) and Abstracts Views on Vision4Press platform.
Data correspond to usage on the plateform after 2015. The current usage metrics is available 48-96 hours after online publication and is updated daily on week days.
Initial download of the metrics may take a while.