Fig. 5
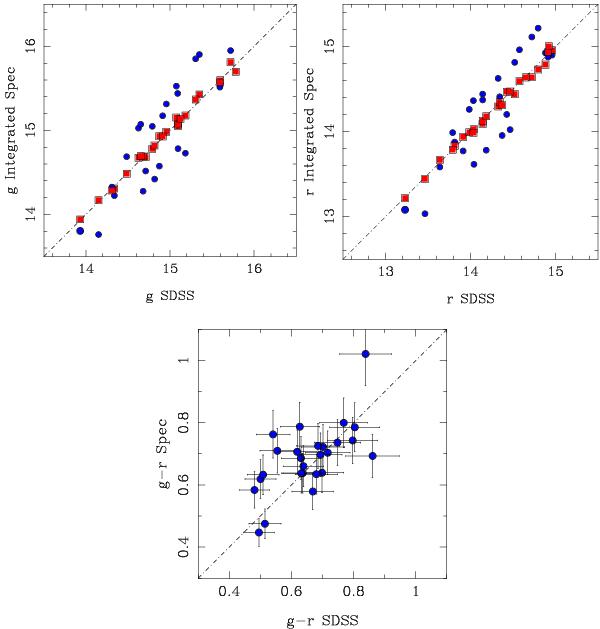
Top: comparison of g (right panel) and r-band (left panel) magnitudes derived from the integrated spectrum within an aperture of 30″/diameter extracted from the V600 datacubes and the corresponding magnitudes derived from the SDSS images, before (blue solid circles) and after (red solid squares) the flux calibration described in the text. Bottom: comparison of g − r colour. Considering the errors in the absolute flux calibration (~8%) and between g and r band (around 4–5%), the expected errors in the colours are ~0.1 mag, consistent with the errors in SDSS photometric data.
Current usage metrics show cumulative count of Article Views (full-text article views including HTML views, PDF and ePub downloads, according to the available data) and Abstracts Views on Vision4Press platform.
Data correspond to usage on the plateform after 2015. The current usage metrics is available 48-96 hours after online publication and is updated daily on week days.
Initial download of the metrics may take a while.