Fig. 2
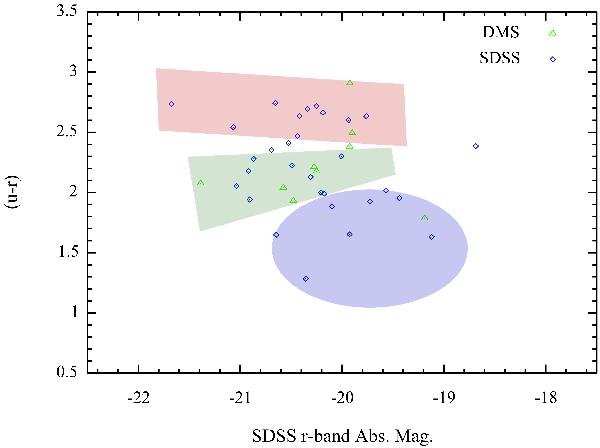
u − r vs. Mr colour–magnitude diagram of the observed sample. In blue circles, we have indicated the DR4 selected sample, and in green triangles those galaxies from the Disk Mass Survey (see text for more detail). The red sequence, green valley, and blue cloud are noted with shaded colour areas. It is clear the observed sample still covers each region with a significant number of objects.
Current usage metrics show cumulative count of Article Views (full-text article views including HTML views, PDF and ePub downloads, according to the available data) and Abstracts Views on Vision4Press platform.
Data correspond to usage on the plateform after 2015. The current usage metrics is available 48-96 hours after online publication and is updated daily on week days.
Initial download of the metrics may take a while.