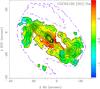
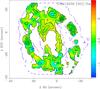
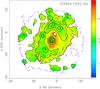
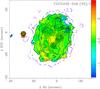
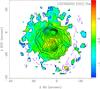
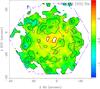
Fig. 18
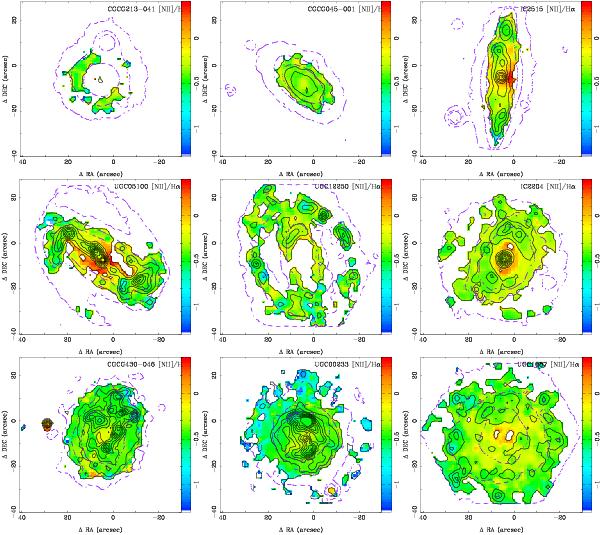
Colour map of the [N ii]λ6583/Hα line ratio derived from the fitting procedures described in the text, for a subset of the observed galaxies. The black solid contours shows the Hα observed intensity, starting at 0.3 × 10⁻¹⁶ erg s-1 cm-2, and with a step of 1 × 10-16 erg s-1 cm-2 for each contour. The blue dashed contours shows the continuum intensity at the RC-band, starting at 0.03 × 10⁻¹⁶ erg s-1 cm-2, with a step of 0.1 × 10⁻¹⁶ erg s-1 cm-2 for each contour.
Current usage metrics show cumulative count of Article Views (full-text article views including HTML views, PDF and ePub downloads, according to the available data) and Abstracts Views on Vision4Press platform.
Data correspond to usage on the plateform after 2015. The current usage metrics is available 48-96 hours after online publication and is updated daily on week days.
Initial download of the metrics may take a while.