Fig. 7
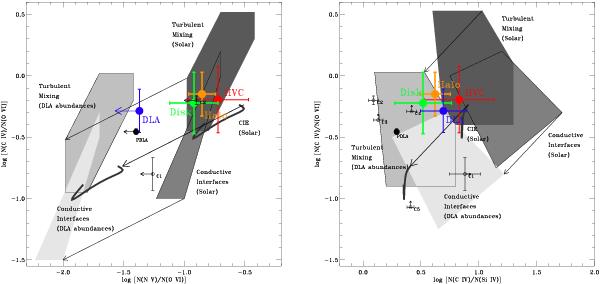
Diagnostic ratio-ratio plots showing C iv/O vi vs. N v/O vi (Fig. 7a; left) and C iv/O vi vs. C iv/Si iv (Fig. 7b; right), comparing observations (of this PDLA and other galaxy-halo environments) with ionization models. The observations shown are the average measurements in the Q0841+129 PDLA (black circles), the component-by-component PDLA measurements (open circles), the DLA average from Fox et al. (2007a) in blue, the Galactic disk average from Lehner et al. (2011) in green, the Galactic halo average from Wakker et al. (2011) in orange, and the Galactic high-velocity cloud (HVC) average from Fox et al. (2005) in red. In each case the error bar shows the standard deviation of the measurements. The ionization models shown (shaded regions) are turbulent mixing layers (Kwak & Shelton 2010), conductive interfaces (Gnat et al. 2010), and CIE (Gnat & Sternberg 2007). The shaded regions show the approximate range of predicted ratios when allowing the model parameters to vary (see text). The black arrows show the effect of correcting the model predictions from a solar relative abundance pattern to a DLA relative abundance pattern with [C/O] = −0.5, [C/Si] = −0.5, and [N/O] = −1.0.
Current usage metrics show cumulative count of Article Views (full-text article views including HTML views, PDF and ePub downloads, according to the available data) and Abstracts Views on Vision4Press platform.
Data correspond to usage on the plateform after 2015. The current usage metrics is available 48-96 hours after online publication and is updated daily on week days.
Initial download of the metrics may take a while.