Fig. 6
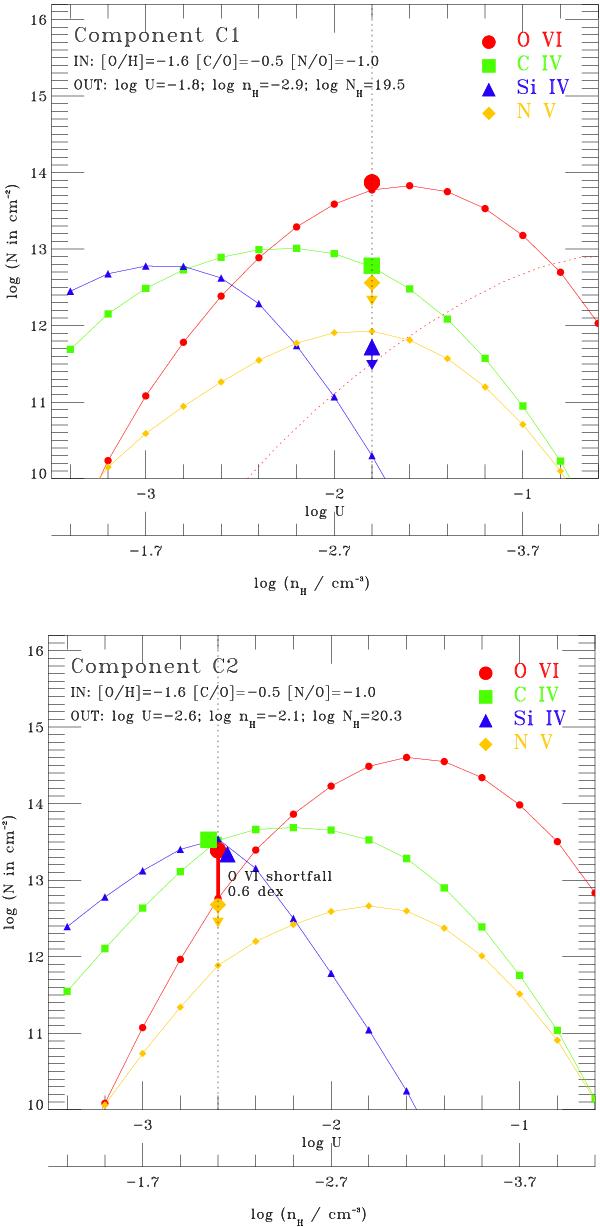
CLOUDY PI models of the high ions in the two PDLA components showing O vi: C1 (at −57 km s-1 relative to zabs), and C2 (at − 12 km s-1). The colored lines show the predicted high-ion column densities versus ionization parameter log U, with the observations (large data points) plotted at the best-fit value of log U. The lower x-axis show the corresponding gas density nH. In the C1 model (upper plot), a solution is found at log U = −1.8 that explains the O vi, C iv, and upper limits on Si iv and N v. The dotted red line shows the O vi prediction from a UVB-only CLOUDY model (i.e., without the ionizing radiation from the QSO). In the C2 model (lower plot), no single-phase solution is found; a fit to the C iv and Si iv at log U = −2.6 under-predicts the O vi column by 0.6 dex (the “O vi shortfall”). These models are described in Sect. 8.1.
Current usage metrics show cumulative count of Article Views (full-text article views including HTML views, PDF and ePub downloads, according to the available data) and Abstracts Views on Vision4Press platform.
Data correspond to usage on the plateform after 2015. The current usage metrics is available 48-96 hours after online publication and is updated daily on week days.
Initial download of the metrics may take a while.