Fig. 3
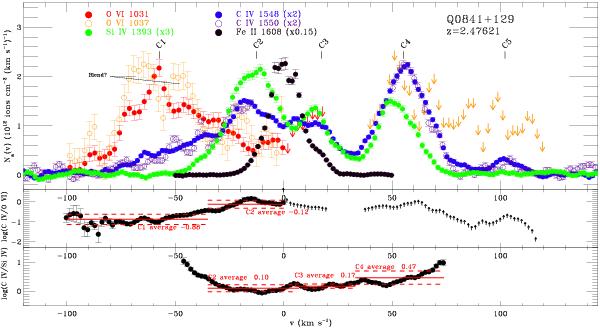
Top panel: apparent column density profiles of high-ion and Fe ii absorption in the zabs = 2.47621 PDLA. Several of the profiles have been scaled by the factors shown in the legend, to allow inter-comparison with the other lines. The O vi profile is only shown at velocities where the two O vi lines overlap; upper limits for O vi are shown at other velocities, using whichever of the two doublet lines gives the stronger constraint. Middle panel: C iv/O vi apparent-column-density ratio as a function of velocity; in pixels with upper limits on O vi, lower limits on the ratio are given. Lower panel: C iv/Si iv apparent-column-density ratio as a function of velocity. The mean (solid lines) and standard deviation (dashed lines) of the logarithmic ratio in each component are shown in red.
Current usage metrics show cumulative count of Article Views (full-text article views including HTML views, PDF and ePub downloads, according to the available data) and Abstracts Views on Vision4Press platform.
Data correspond to usage on the plateform after 2015. The current usage metrics is available 48-96 hours after online publication and is updated daily on week days.
Initial download of the metrics may take a while.