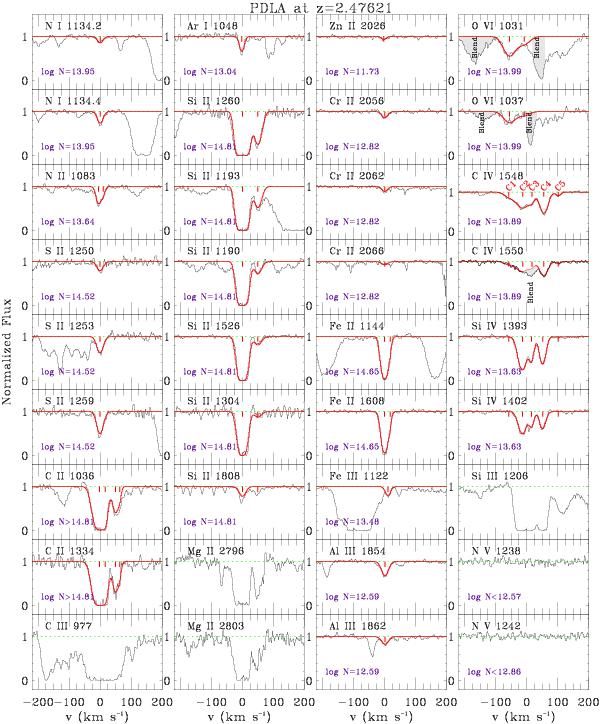
Fig. 2

Normalized VLT/UVES absorption-line profiles in the PDLA at z = 2.47621 toward Q0841+129. Red lines show Voigt-profile fits, with tick marks showing component centers. Fits were not attempted for Si iii, C iii, or Mg ii due to extreme saturation. Grey shaded regions indicate blends. The total column density obtained from component fitting (summed over components) is annotated on each panel.
Current usage metrics show cumulative count of Article Views (full-text article views including HTML views, PDF and ePub downloads, according to the available data) and Abstracts Views on Vision4Press platform.
Data correspond to usage on the plateform after 2015. The current usage metrics is available 48-96 hours after online publication and is updated daily on week days.
Initial download of the metrics may take a while.


