Fig. 1
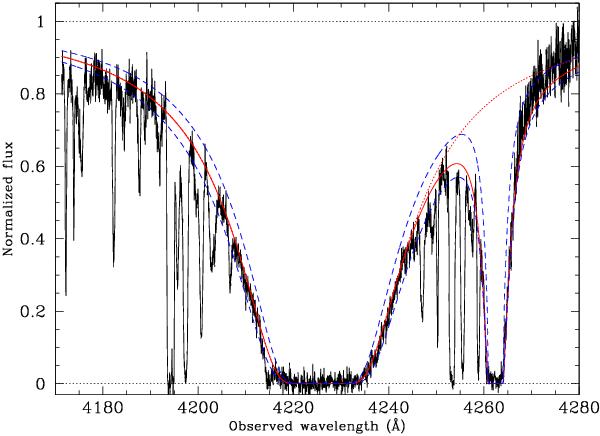
Ly-α profile in the two proximate absorbers toward Q0841+129. The red line shows the best-fit Voigt profile with log N(H i) = 20.80 ± 0.10 in the DLA at zabs = 2.47621 (centre of the figure) and log N(H i) = 19.00 ± 0.15 in the sub-DLA at zabs = 2.50620 (toward the right). 1σ errors are shown with blue dashed lines. The red dotted line shows the fit to the DLA only.
Current usage metrics show cumulative count of Article Views (full-text article views including HTML views, PDF and ePub downloads, according to the available data) and Abstracts Views on Vision4Press platform.
Data correspond to usage on the plateform after 2015. The current usage metrics is available 48-96 hours after online publication and is updated daily on week days.
Initial download of the metrics may take a while.