Fig. 7
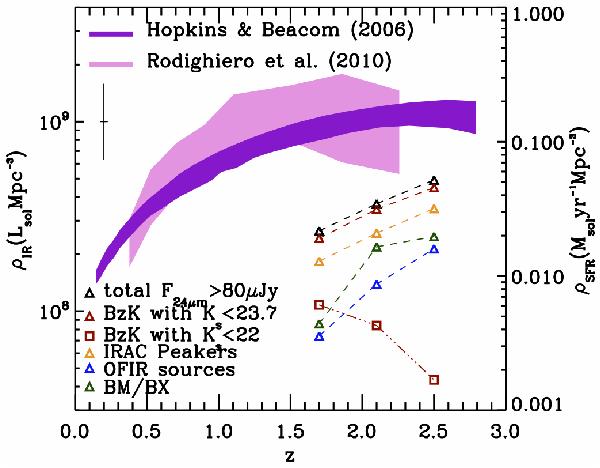
Total infrared luminosity density produced at 1.5 < z < 1.9, 1.9 < z < 2.3 and 2.3 < z < 2.7 by 24 μm sources with F24 μm > 0.08 mJy (black triangles), compared to the contribution of 24 μm sources identified with the selection techniques described in Sects. 3 and 4 (red: BzK; green: BM/BX; yellow: IRAC peakers; blue: OFIR galaxies with photo-z identification). For galaxy samples where the MIPS 24 μm emission is mostly produced by star formation (i.e., BzK and BM/BX soursces, IRAC peakers) the IR luminosity density can be read as a star formation density (right vertical axis) assuming the conversion from Kennicutt (1998). For comparison, the evolution of the total IR luminosity density inferred by Rodighiero et al. (2010) up to z ~ 2.5 is illustrated by the lightly shaded region. The cosmic star formation history derived by Hopkins & Beacom (2006) is represented by the dark shaded area. The typical uncertainty affecting our estimates is shown by the vertical line in the top left corner of the diagram.
Current usage metrics show cumulative count of Article Views (full-text article views including HTML views, PDF and ePub downloads, according to the available data) and Abstracts Views on Vision4Press platform.
Data correspond to usage on the plateform after 2015. The current usage metrics is available 48-96 hours after online publication and is updated daily on week days.
Initial download of the metrics may take a while.