Fig. 5
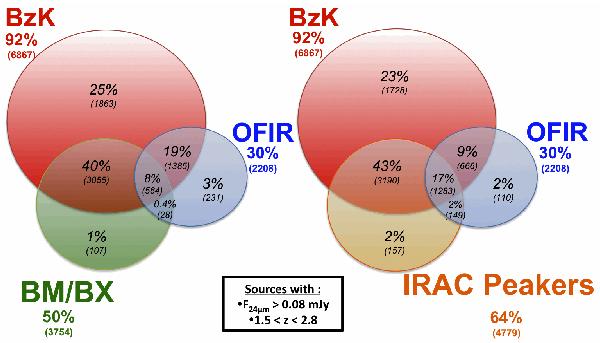
Overlap between the populations of 24 μm sources with F24 μm > 0.08 mJy on the redshift range 1.5 < z < 2.8. The percentages in bold are related to the total number of sources selected by the criterion considered. The percentages in italic correspond to the overlap between the populations. Left: overlap between the BzK, the BM/BX, and the OFIR sources. Right: overlap between the BzK, the OFIR sources, and the IRAC peakers.
Current usage metrics show cumulative count of Article Views (full-text article views including HTML views, PDF and ePub downloads, according to the available data) and Abstracts Views on Vision4Press platform.
Data correspond to usage on the plateform after 2015. The current usage metrics is available 48-96 hours after online publication and is updated daily on week days.
Initial download of the metrics may take a while.