Fig. 6
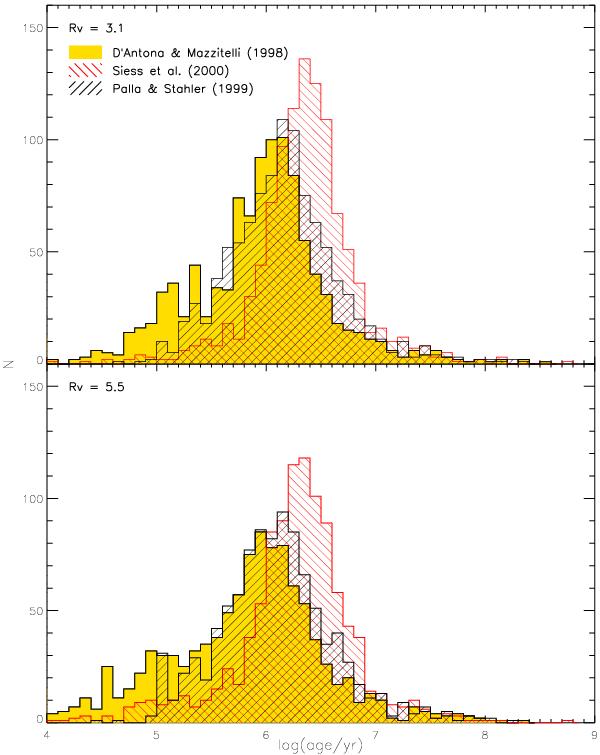
Distributions of stellar ages for different PMS evolutionary models. These histograms correspond to the reddening laws RV = 3.1 (top) and RV = 5.5 (bottom). The yellow histogram represents the results obtained by interpolating the D’Antona & Mazzitelli (1997) isochrones. The red hatched histogram corresponds to Siess et al. (2000), while the black hatched one represents Palla & Stahler (1999) predictions.
Current usage metrics show cumulative count of Article Views (full-text article views including HTML views, PDF and ePub downloads, according to the available data) and Abstracts Views on Vision4Press platform.
Data correspond to usage on the plateform after 2015. The current usage metrics is available 48-96 hours after online publication and is updated daily on week days.
Initial download of the metrics may take a while.