Fig. 4
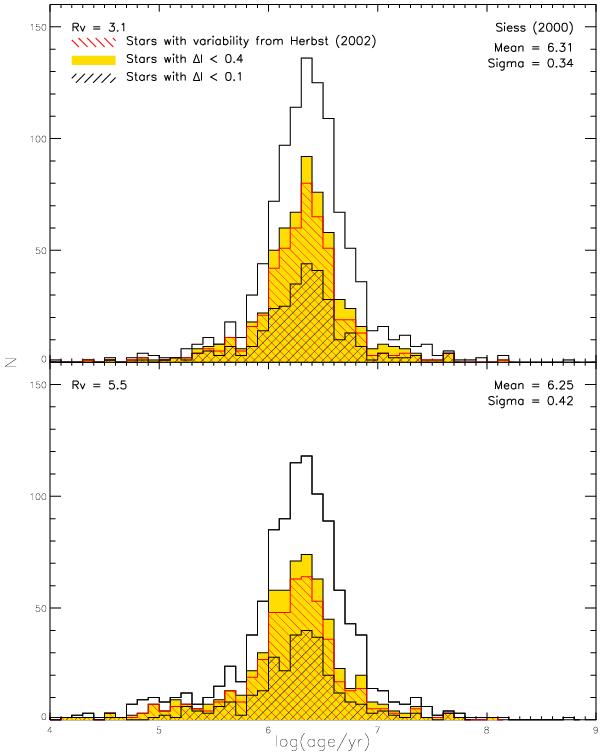
Distributions of stellar ages for low variability stars. The stellar ages are derived from Siess et al. (2000) evolutionary calculations for the reddening laws RV = 3.1 (top) and RV = 5.5 (bottom). The open histogram represents the total sample. The yellow area indicates the sample of 608 stars for which we have information about variability from Herbst et al. (2002). The red hatched histogram represents the sources selected with ΔI ≤ 0.4 mag, while the black one corresponds to stars with ΔI ≤ 0.1. The average age of the cluster and the age spread are relative to the third sample.
Current usage metrics show cumulative count of Article Views (full-text article views including HTML views, PDF and ePub downloads, according to the available data) and Abstracts Views on Vision4Press platform.
Data correspond to usage on the plateform after 2015. The current usage metrics is available 48-96 hours after online publication and is updated daily on week days.
Initial download of the metrics may take a while.