Fig. 11
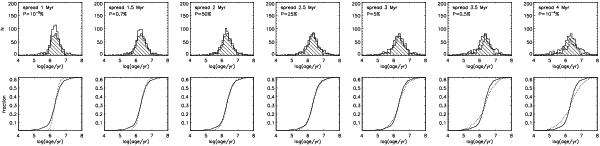
Age spread test. Top, from left to right: the open histograms represent the age distribution simulated for a sample of stars of mean age of 2.2 Myr, assuming an observational uncertainty on the luminosity of σ(log L) = 0.10 and intrinsic age spreads of 1, 1.5, 2, 1.5, 3, 1.5, and 4 Myr, respectively. The KS test probability that the two distributions are drawn from the same parent function is also given. Bottom: cumulative functions for each simulation. We use the same legend as in Fig. 10.
Current usage metrics show cumulative count of Article Views (full-text article views including HTML views, PDF and ePub downloads, according to the available data) and Abstracts Views on Vision4Press platform.
Data correspond to usage on the plateform after 2015. The current usage metrics is available 48-96 hours after online publication and is updated daily on week days.
Initial download of the metrics may take a while.