Fig. 10
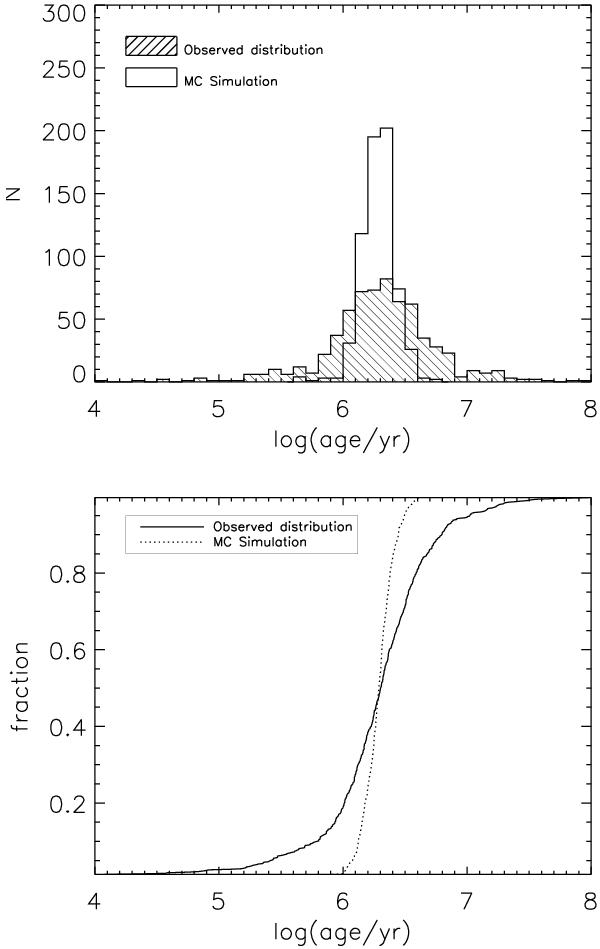
Test of coeval population. Top: The open histogram represents the age distribution simulated for a sample of stars uniformly distributed along a 2.2 Myr isochrone from Siess et al. (2000), assuming an observational uncertainty in the luminosity of σ(log L) = 0.10. The spread in age is σ(log t) = 0.13. The hatched histogram shows the observed age distribution for the observed completeness-limited subsample. Bottom: Cumulative functions of the the two distributions. Solid and dotted line represent the observed and simulated sample, respectively.
Current usage metrics show cumulative count of Article Views (full-text article views including HTML views, PDF and ePub downloads, according to the available data) and Abstracts Views on Vision4Press platform.
Data correspond to usage on the plateform after 2015. The current usage metrics is available 48-96 hours after online publication and is updated daily on week days.
Initial download of the metrics may take a while.