Fig. 9
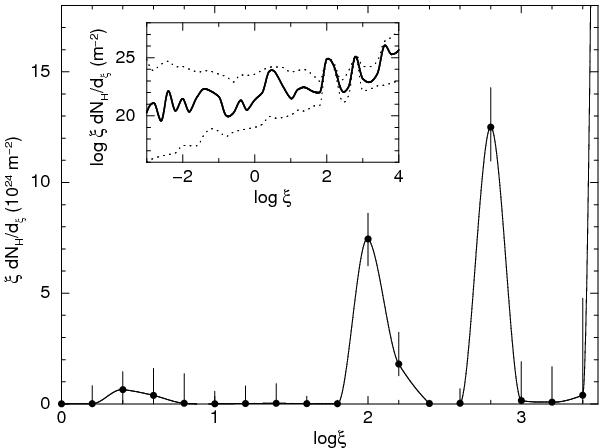
Continuous absorption measure distribution plotted as
ξA(ξ) for Mrk 509. Shown is the median of the
117 runs with  . Error bars correspond to the
minimum and maximum value of the AMD at each value of ξ for those
runs with acceptable χ2. Note the two strong and
isolated peaks at log ξ = 2.0 and 2.8, respectively. The inset
shows our results on a logarithmic scale for a broader range of ionization
parameter; dotted lines connect the minimum and maximum values of all acceptable
solutions.
. Error bars correspond to the
minimum and maximum value of the AMD at each value of ξ for those
runs with acceptable χ2. Note the two strong and
isolated peaks at log ξ = 2.0 and 2.8, respectively. The inset
shows our results on a logarithmic scale for a broader range of ionization
parameter; dotted lines connect the minimum and maximum values of all acceptable
solutions.
Current usage metrics show cumulative count of Article Views (full-text article views including HTML views, PDF and ePub downloads, according to the available data) and Abstracts Views on Vision4Press platform.
Data correspond to usage on the plateform after 2015. The current usage metrics is available 48-96 hours after online publication and is updated daily on week days.
Initial download of the metrics may take a while.