Fig. 11
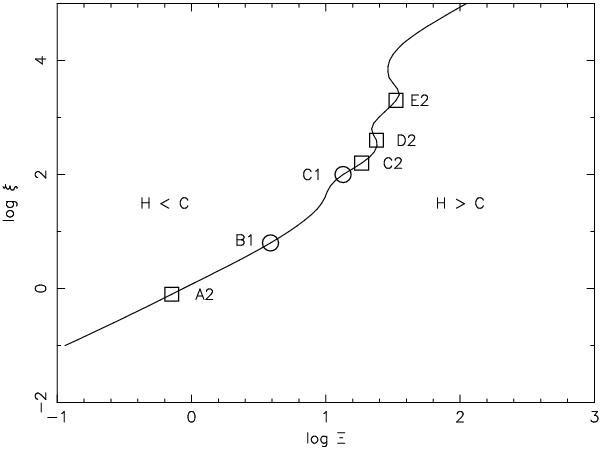
Cooling curve derived for the SED with the ionization parameters obtained from Model 3 over-plotted. The circles indicate the ionization parameters for the slow velocity component, while the squares shown are for the fast outflow. Regions where heating (H) or cooling (C) dominate are also indicated.
Current usage metrics show cumulative count of Article Views (full-text article views including HTML views, PDF and ePub downloads, according to the available data) and Abstracts Views on Vision4Press platform.
Data correspond to usage on the plateform after 2015. The current usage metrics is available 48-96 hours after online publication and is updated daily on week days.
Initial download of the metrics may take a while.