Fig. 6
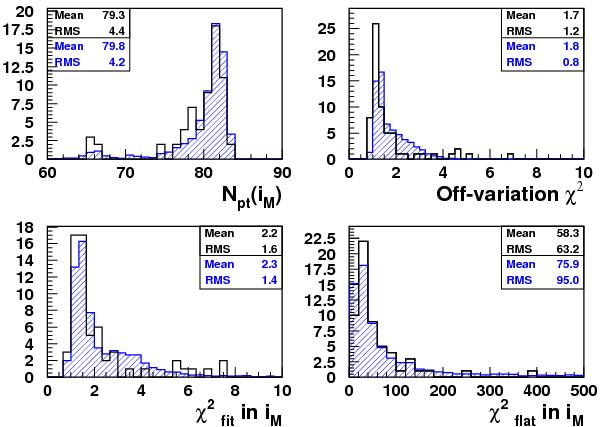
Comparison between spectroscopically identified SN Ia data (open histogram) and synthetic light curves of bright SNe Ia (hatched histogram) in the D1 field. Distributions show the total number of points in the iM light curve and three χ2 variables used in the analysis (see text). The mean and rms of each distributions are indicated in the upper box for data and in the lower one for simulation.
Current usage metrics show cumulative count of Article Views (full-text article views including HTML views, PDF and ePub downloads, according to the available data) and Abstracts Views on Vision4Press platform.
Data correspond to usage on the plateform after 2015. The current usage metrics is available 48-96 hours after online publication and is updated daily on week days.
Initial download of the metrics may take a while.