Free Access
Fig. 4
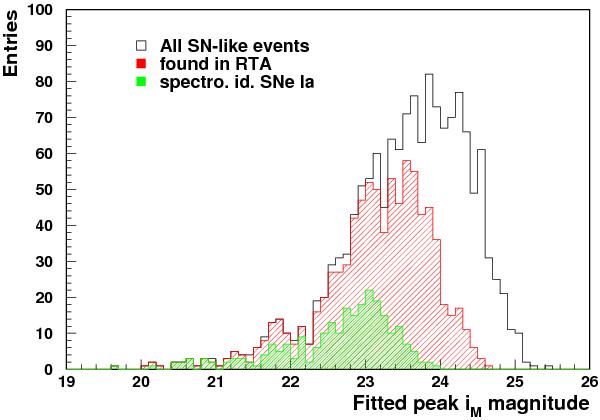
Fitted iM peak magnitude distribution of selected SN-like events. Among these, events matched to SNLS real-time candidates (resp. spectroscopically identified SNe Ia) correspond to the red (resp. green) hatched histogram.
Current usage metrics show cumulative count of Article Views (full-text article views including HTML views, PDF and ePub downloads, according to the available data) and Abstracts Views on Vision4Press platform.
Data correspond to usage on the plateform after 2015. The current usage metrics is available 48-96 hours after online publication and is updated daily on week days.
Initial download of the metrics may take a while.