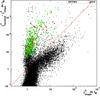
Fig. 3
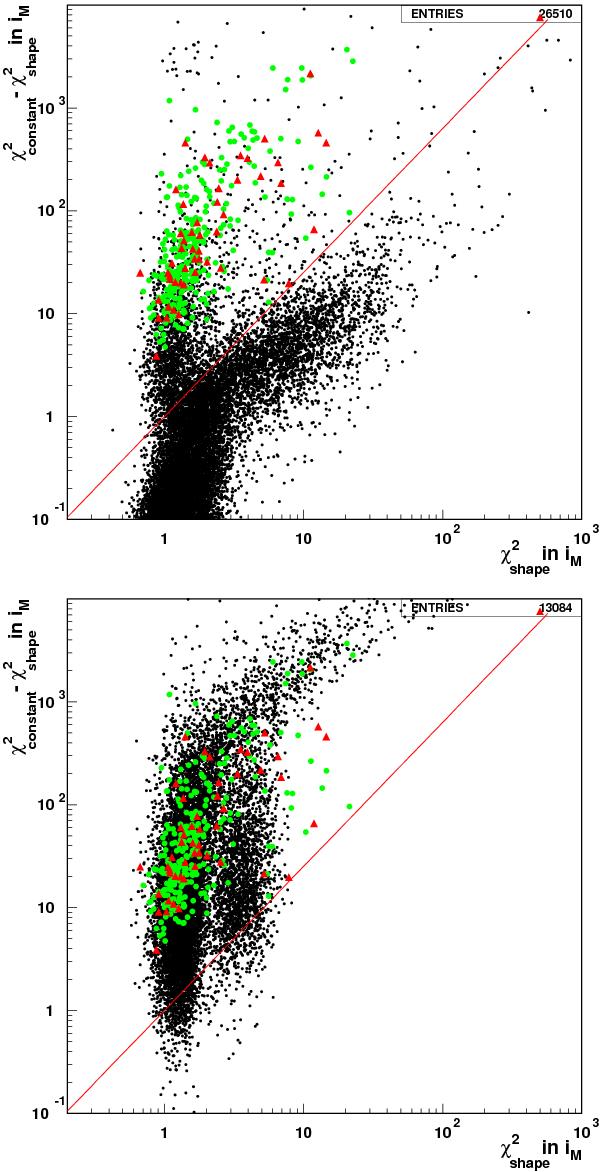
Difference in reduced χ2 between iM light curve fits by a constant and by an SN-like shape (see text), as a function of the latter χ2. All cuts of the SN selection previous to that illustrated in this figure have been applied. Black dots stand for SNLS data (top) and synthetic SN Ia events (bottom). In both plots, green squares (resp. red triangles) are data events identified by spectroscopy as Type Ia (resp. core-collapse) SNe. Events above the curve are selected by the analysis.
Current usage metrics show cumulative count of Article Views (full-text article views including HTML views, PDF and ePub downloads, according to the available data) and Abstracts Views on Vision4Press platform.
Data correspond to usage on the plateform after 2015. The current usage metrics is available 48-96 hours after online publication and is updated daily on week days.
Initial download of the metrics may take a while.