Fig. A.5
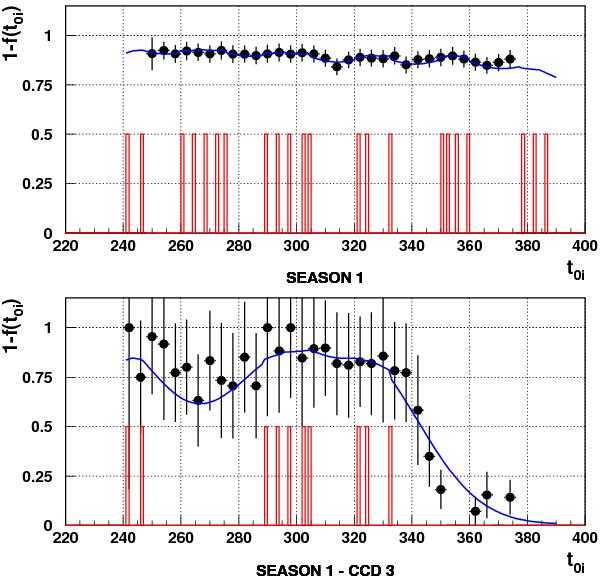
Temporal dependence of the detection efficiency, 1 − f(t0i), on D1, with dates originating at January 0, 2003. The model (blue curve) is compared with Monte Carlo estimates (black points). Actual observation dates are shown as the lower red histograms. The bottom plot is for CCD 3 which failed to work during the second and the last two lunations. The top plot is for the rest of the mosaic.
Current usage metrics show cumulative count of Article Views (full-text article views including HTML views, PDF and ePub downloads, according to the available data) and Abstracts Views on Vision4Press platform.
Data correspond to usage on the plateform after 2015. The current usage metrics is available 48-96 hours after online publication and is updated daily on week days.
Initial download of the metrics may take a while.