Fig. A.4
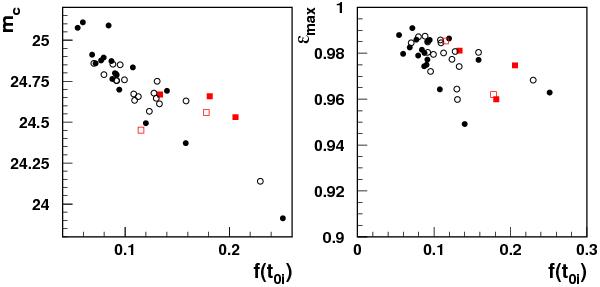
Correlations between the measured parameters (mc and ϵmax) and f(t0i), as observed in the D1 Monte Carlo. Each point is an average over all t0i dates in a lunation (filled symbols) or inter-lunation period (open symbols). Circles are averaged over the full mosaic, except for the first season where CCD 3 has been singled out (red squares) due to intermittent failures. Linear fits are used in the model to describe the observed correlations.
Current usage metrics show cumulative count of Article Views (full-text article views including HTML views, PDF and ePub downloads, according to the available data) and Abstracts Views on Vision4Press platform.
Data correspond to usage on the plateform after 2015. The current usage metrics is available 48-96 hours after online publication and is updated daily on week days.
Initial download of the metrics may take a while.