Fig. A.1
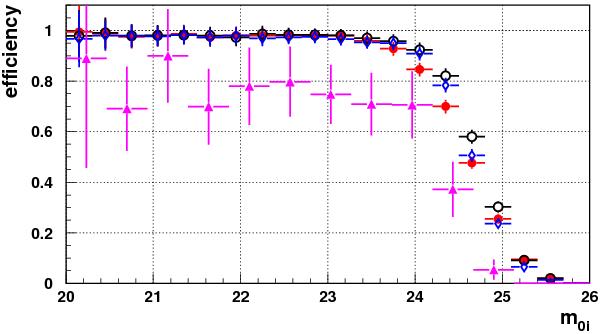
Detection efficiency ϵ(m0i) on D1 derived from Monte Carlo images as a function of the generated magnitude m0i at maximum light. Blue diamonds illustrate the efficiency for the first season of data (averaged over the full mosaic excluding CCD 3), red disks are for the second season (full mosaic), open black circles are for the third season (full mosaic), and pink triangles are for the supernovae occurring during the first season on CCD 3.
Current usage metrics show cumulative count of Article Views (full-text article views including HTML views, PDF and ePub downloads, according to the available data) and Abstracts Views on Vision4Press platform.
Data correspond to usage on the plateform after 2015. The current usage metrics is available 48-96 hours after online publication and is updated daily on week days.
Initial download of the metrics may take a while.