Fig. 21
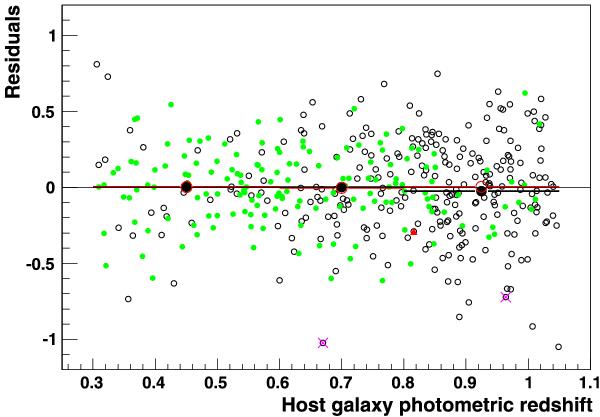
Hubble diagram residuals. Green dots stand for the identified SN Ia subsample and open black circles for the unidentified subsample. Means are shown in three redshift bins, black for identified events, red for full sample. The red upward triangle is event SNLS 06D2bo which was erroneously typed as a possible core-collapse supernova initially (see Sect. 4.2 for details). The pink crosses mark the two 3σ outliers, which were excluded in the computation of the means.
Current usage metrics show cumulative count of Article Views (full-text article views including HTML views, PDF and ePub downloads, according to the available data) and Abstracts Views on Vision4Press platform.
Data correspond to usage on the plateform after 2015. The current usage metrics is available 48-96 hours after online publication and is updated daily on week days.
Initial download of the metrics may take a while.