Free Access
Fig. 18
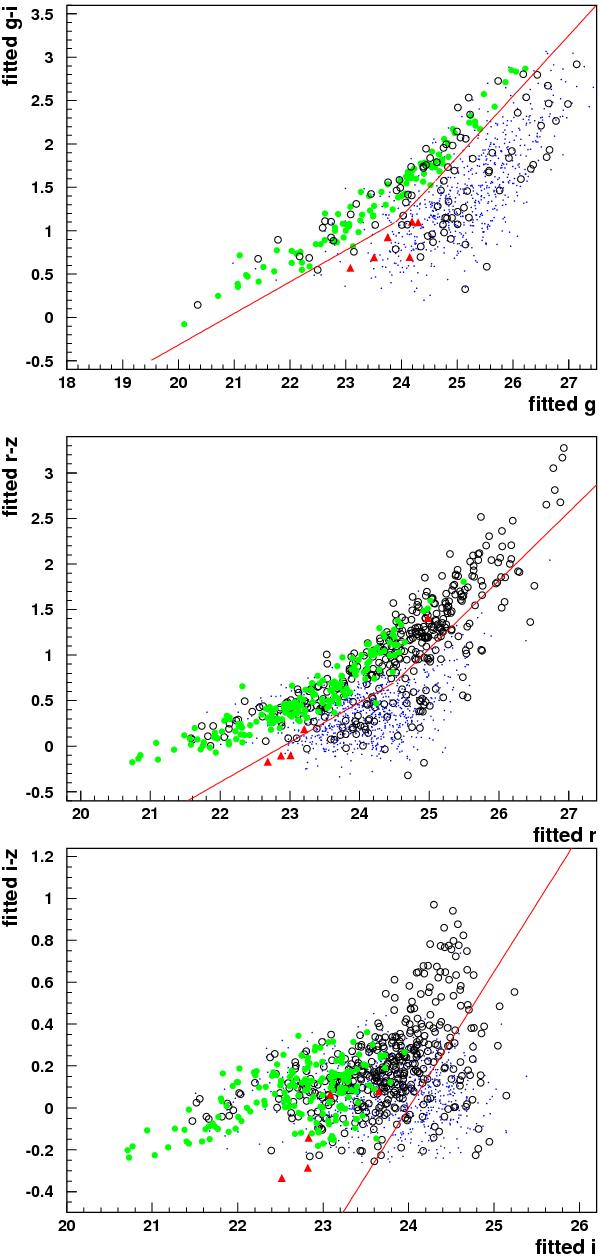
Colour − magnitude diagrams from SALT2 fitted magnitudes used in the photometric SN Ia selection, for synthetic core-collapse events and data events that have passed all selections prior to those based on these diagrams. Same colour code as in Fig. 17.
This figure is made of several images, please see below:
Current usage metrics show cumulative count of Article Views (full-text article views including HTML views, PDF and ePub downloads, according to the available data) and Abstracts Views on Vision4Press platform.
Data correspond to usage on the plateform after 2015. The current usage metrics is available 48-96 hours after online publication and is updated daily on week days.
Initial download of the metrics may take a while.