Fig. 17
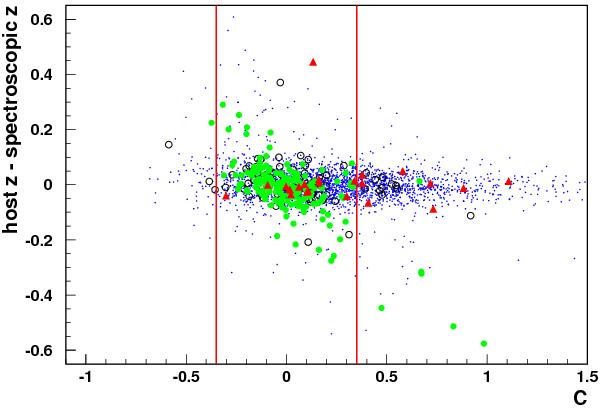
Difference between redshift assignments as a function of the SALT2 fitted colour, for synthetic core-collapse events (blue dots) and data events (all other symbols), after all selections previous to that on SALT2 X1 and colour (see text). Green circles (resp. red triangles) are data events present in our sample which have been identified as Type Ia (resp. core-collapse) supernovae by spectroscopy. Open black circles stand for data events with no spectroscopic identification.
Current usage metrics show cumulative count of Article Views (full-text article views including HTML views, PDF and ePub downloads, according to the available data) and Abstracts Views on Vision4Press platform.
Data correspond to usage on the plateform after 2015. The current usage metrics is available 48-96 hours after online publication and is updated daily on week days.
Initial download of the metrics may take a while.