Fig. 16
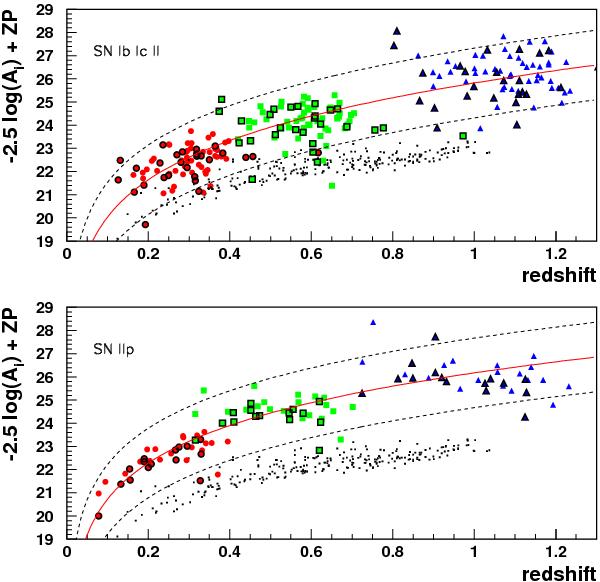
Magnitude corresponding to Ai, the iM-band amplitude parameter of the model representing SN light curves, as a function of redshift, for fast-declining CC supernovae (top) and plateau ones (bottom), as measured in the 3-year SNLS data. Red dots come from fits to iM-band light curves, green squares (resp. blue triangles) from fits in the rM (resp. gM) filter taken as estimates of Ai at higher redshifts (see text). Symbols with black borders indicate spectroscopically identified events. The curves are fits to the average redshift dependence of the magnitude, excluding points outside the dashed lines. As a comparison, black dots give magnitudes from spectroscopically identified SNe Ia.
Current usage metrics show cumulative count of Article Views (full-text article views including HTML views, PDF and ePub downloads, according to the available data) and Abstracts Views on Vision4Press platform.
Data correspond to usage on the plateform after 2015. The current usage metrics is available 48-96 hours after online publication and is updated daily on week days.
Initial download of the metrics may take a while.