Fig. 14
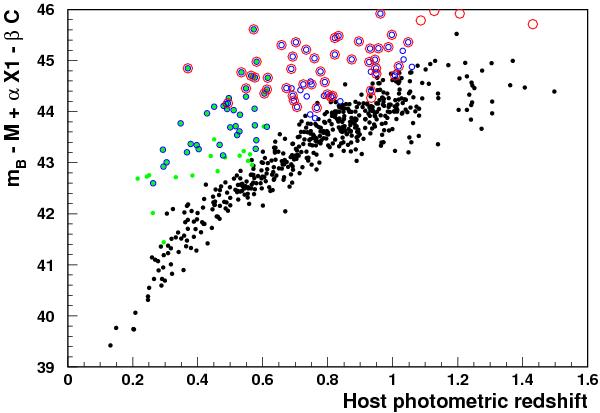
Hubble diagram for data events at different levels of the photometric SN Ia selection. Black dots stand for events at the end of the selection, green filled (resp. open blue) circles for events rejected by the constraints on the SALT2 fitted g − i vs. g (resp. i − z vs. i) colour-magnitude diagram, open red circles for events rejected by the constraints on the SALT2 fitted r − z vs. r diagram.
Current usage metrics show cumulative count of Article Views (full-text article views including HTML views, PDF and ePub downloads, according to the available data) and Abstracts Views on Vision4Press platform.
Data correspond to usage on the plateform after 2015. The current usage metrics is available 48-96 hours after online publication and is updated daily on week days.
Initial download of the metrics may take a while.